February 09, 2025
Generative Animated SVG - Formula & Descriptions
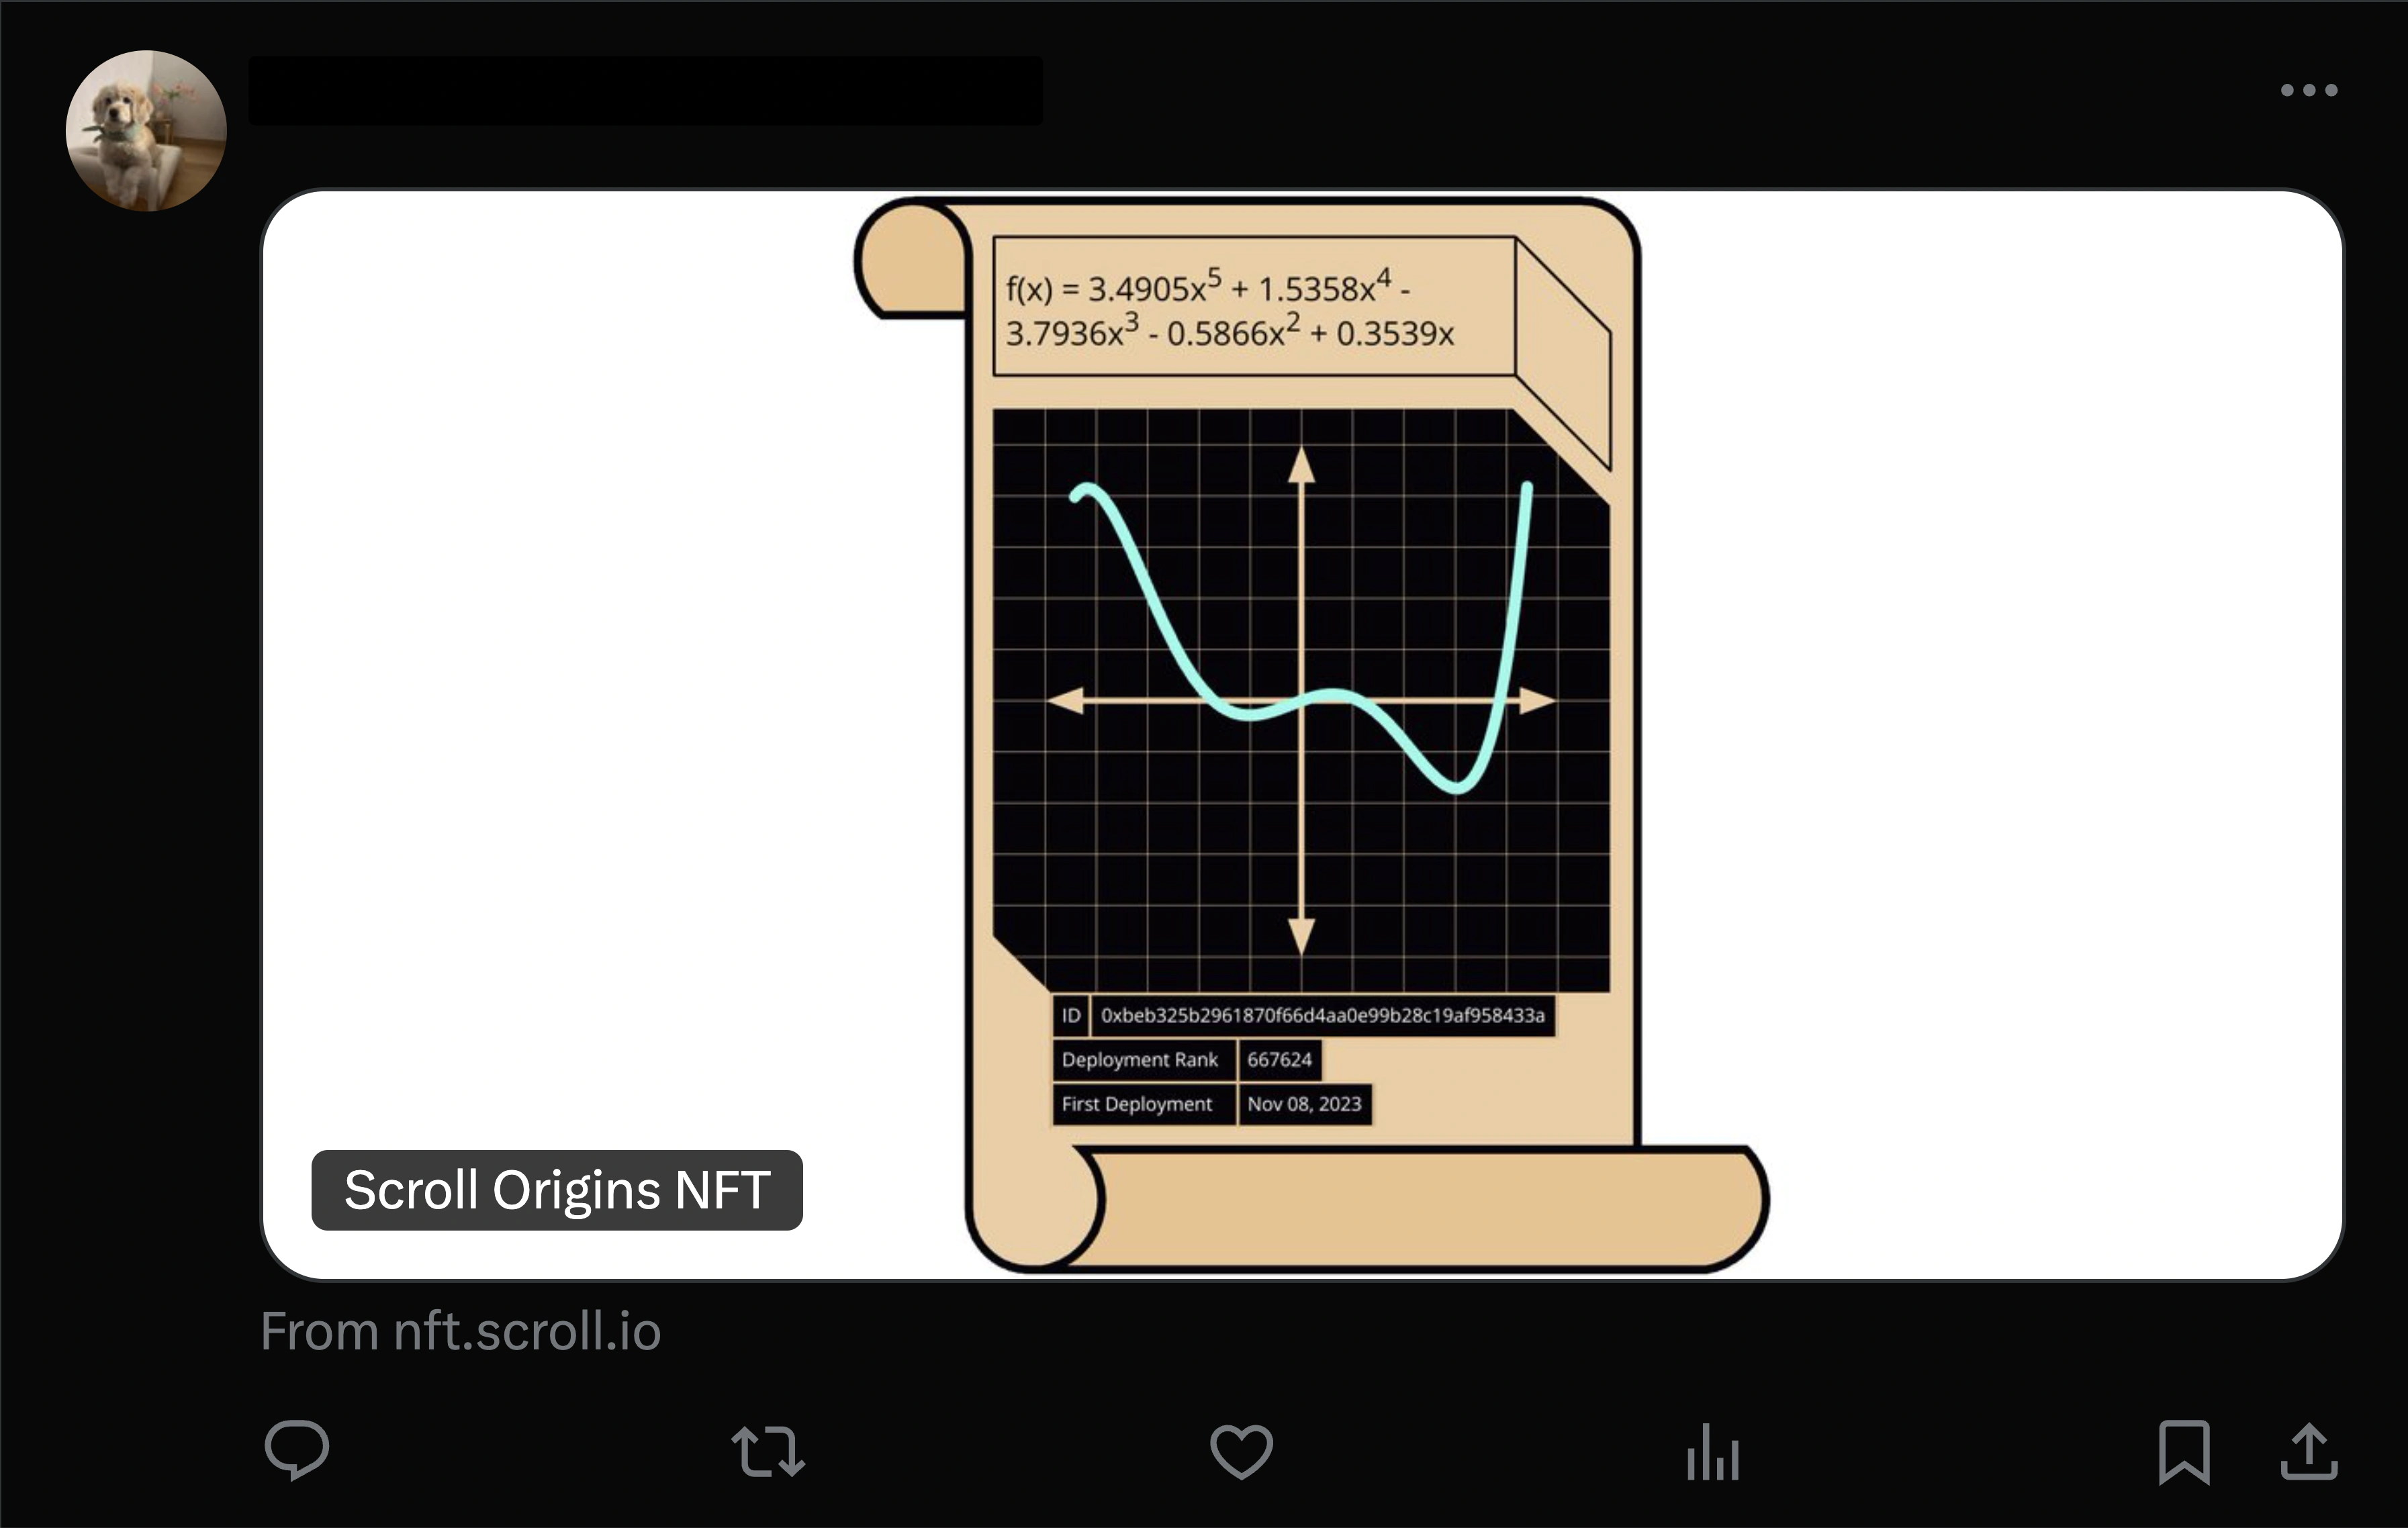
Scroll Origins NFT
For more context, check out Generative Animated SVG - Curve.
At the beginning, to stay focused, let’s remove the curve region from the SVG.

With the complexity reduced, the task now feels much more manageable.
Formula
The origin formula was made by <text> and <tspan>
1<text transform="matrix(1 0 0 1 83.8207 36.6262)">
2  <tspan x="0" y="0" class="st0 st83 st84">f(x)=4x^5+3x^4+2x^3</tspan>
3  <tspan x="0" y="17.38" class="st0 st83 st84">+4x^2+6x+8</tspan>
4</text>
And the outline rectangle is as follows:
1<rect x="79.69" y="15.45" class="st4" width="176.55" height="46.86" />Requirements
-
The formula of any generated cubic, quartic, or quintic functions must fit within the box and be centered both horizontally and vertically.
-
Exponents should be positioned at the top-right of the x rather than represented using a caret (^).
-
For a good user experience, consistency, and compatibility, browser safe fonts should be used.
Current
The Python script returned the function’s coefficient array generated from "928454".
1;[
2  5.179354666686315, 1.6290417175280287, -7.465469156262041, -1.711825295840088,
3  1.9709397966745672, 0,
4]
Each coefficient appears extremely long and clearly wouldn’t fit in this small box. To balance display and precision, each coefficient is rounded to four decimals.
f(x) = 5.1794x5 + 1.6290x4 - 7.4655x3 - 1.7118x 2 + 1.9709x
Issues
Then, problems arose.
- The
<text>element lacks a width attribute and doesn’t support line breaks, making it challenging to determine where to wrap the function expression. - How to center the entire formula horizontally and vertically when it spans 2, 3, or even 4 lines?
- How to position the exponents in the top-right corner of x?
For the last one, <tspan> can be used to render exponents by adjusting the dy attribute to position the exponent at the top-right of x.
However, this offset affects all subsequent text, so we must reset the baseline afterward. Thus, the final code for rendering the formula should be:
1<style>
2  .st86 {
3    font-family: "Arial";
4    font-size: 16px;
5  }
6</style>
7
8<text class="st86" transform="translate(83.8207, 36.6262)">
9  <tspan x="0" y="0">f(x)=5.1794x</tspan><tspan dy="-6px">5</tspan>
10  <tspan dy="6px"> + 1.6290x</tspan><tspan dy="-6px">4</tspan>
11  <tspan dy="6px"> - 7.4655x</tspan><tspan dy="-6px">3</tspan>
12  <tspan dy='6px'> - 1.7118x</tspan><tspan dy="-6px">2</tspan>
13  <tspan dy="6px"> + 1.9709x</tspan>
14</text>
If only I could use <p> tags and a flex layout!
Solution
The SVG standard provides <foreignObject>, which allows embedding XML-based content, typically HTML in browsers. With <foreignObject>, we can define the formula’s canvas based on the rectangle’s position and dimensions. Within this canvas, we can use familiar HTML and CSS, including the <sup> for rendering exponents.
However, practical scenarios always come with a host of challenges and considerations:
- The function should have some padding from the border for better aesthetics.
- No matter how long the function is, it should be confined to two lines, three lines can appear too cramped, and making the text too small hampers readability.
- Use word-break instead of break-all. Although word-break may introduce extra whitespace on the right, slightly misaligning the formula, break-all makes the formula a bit unreadable.
After weighing all the tradeoffs, here’s the final code
1<foreignObject
2  width="176.55"
3  height="46.86"
4  transform="translate(79.69, 15.45)"
5>
6  /* In the context of SVG embedded in an HTML document, the XHTML namespace */
7  /* could be omitted, but it is mandatory in the context of an SVG document */
8  <div
9    xmlns="http://www.w3.org/1999/xhtml"
10    style="margin:0;height:100%;display:flex;align-items:center;padding:0 4px;"
11  >
12    <p style="font-family:'Arial';font-size:11px;line-height:1.2">
13      f(x) = 5.1794x<sup>5</sup> + 1.6290x<sup>4</sup> - 7.4655x<sup>3</sup> - 1.7118x<sup>2</sup> + 1.9709x
14    </p>
15  </div>
16</foreignObject>
Output

Descriptions
The origin descriptions were made by <text> and <rect>
1<g>
2  <rect x="98.72" y="300.06" class="st8" width="115.65" height="14.36" />
3  <rect x="98.72" y="271.33" class="st8" width="16.36" height="14.36" />
4  <rect x="98.72" y="285.7" class="st8" width="66.59" height="14.36" />
5  <rect x="98.72" y="300.06" class="st8" width="66.59" height="14.36" />
6  <rect
7    x="115.08"
8    y="271.33"
9    transform="matrix(-1 -1.224647e-16 1.224647e-16 -1 403.3613 557.0326)"
10    class="st8"
11    width="173.21"
12    height="14.36"
13  />
14  <rect
15    x="165.31"
16    y="285.7"
17    transform="matrix(-1 -1.224647e-16 1.224647e-16 -1 343.4104 585.7624)"
18    class="st8"
19    width="12.79"
20    height="14.36"
21  />
22  <text transform="matrix(1 0 0 1 103.2064 281.2463)" class="st85 st86 st87"
23    >ID:
24  </text>
25  <text transform="matrix(1 0 0 1 118.3305 281.2463)" class="st85 st86 st87"
26    >0xe4657139e50E909731de703E1728128197a90447</text
27  >
28  <text transform="matrix(1 0 0 1 103.2064 295.0315)" class="st85 st86 st87"
29    >Deployment Rank:</text
30  >
31  <text transform="matrix(1 0 0 1 169.5429 295.0315)" class="st85 st86 st87"
32    >3</text
33  >
34  <text transform="matrix(1 0 0 1 103.2064 309.3469)" class="st85 st86 st87"
35    >Deployment Date:</text
36  >
37  <text transform="matrix(1 0 0 1 170.0502 309.3469)" class="st85 st86 st87"
38    >Nov 15,2023</text
39  >
40</g>
The <rect> is used to render the black background along with a border in the theme color, while <text> handles the text rendering.
Requirements
- The first line, ID, shows an Ethereum wallet address, typically 42 characters. Its right edge should aligned with the black background of the curve region.
- The second line, Deployment Rank, is variable (ranging from 1 to 9999 or more). The background for its right-side value should adjust to the value’s width.
- The third line, Deployment Date, is also variable, so the same dynamic background adjustment applies.
Current
If I continue using <text> and <rect>, it’s hard to dynamically adjust the background to fit the value’s length. On the other hand, stretching the background for the last two lines all the way to the right just doesn’t look appealing.
So, I’ve decided to stick with <foreignObject>.
Code
1<style>
2  .row {
3    margin: 0;
4  }
5
6  .row span {
7    display: inline-block;
8    height: 14px;
9    line-height: 14px;
10    background: #050308;
11    padding: 0 3px;
12    border: 1px solid #ebc28e;
13  }
14
15  .row span:nth-child(even) {
16    border-left: none;
17  }
18
19  .row:nth-child(n + 2) {
20    margin-top: -1px;
21  }
22
23  .row:nth-child(n + 2) span:nth-child(1) {
24    width: 55.8px;
25  }
26</style>
27
28<foreignObject width="189.56" height="46" transform="translate(98.72, 271.33)">
29  <div
30    xmlns="http://www.w3.org/1999/xhtml"
31    style="margin:0;height:100%;font-size:7px;font-family:'Arial';color:white"
32  >
33    <p class="row">
34      <span>ID</span><span>0xe4657139e50E909731de703E1728128197a90447</span>
35    </p>
36    <p class="row"><span>Deployment Rank</span><span>928454</span></p>
37    <p class="row"><span>First Deployment</span><span>Feb 02,2025</span></p>
38  </div>
39</foreignObject>
Output

Wrapping Up
By reintegrating the curve region, we now have a complete, programmatically generated animated SVG.

Finally, all that’s left is the dazzling background color, which you can explore in detail through Color.
Stay Tuned
A few days later, someone suggested enabling users to share their NFTs on Twitter, ensuring the NFT appears in the preview image.
Remember, we used <foreignObject>, which isn’t widely supported. Generating NFT preview images on the server side, however, is an entirely different story.